Every year at about this time, as I prepare to archive another year’s racing president standings, I ask myself whether it’s worth it to continue the blog. Then I meet somebody — a loyal reader who’s a team employee or a descendant of Teddy Roosevelt. Or somebody like Mike Cisneros comes along.
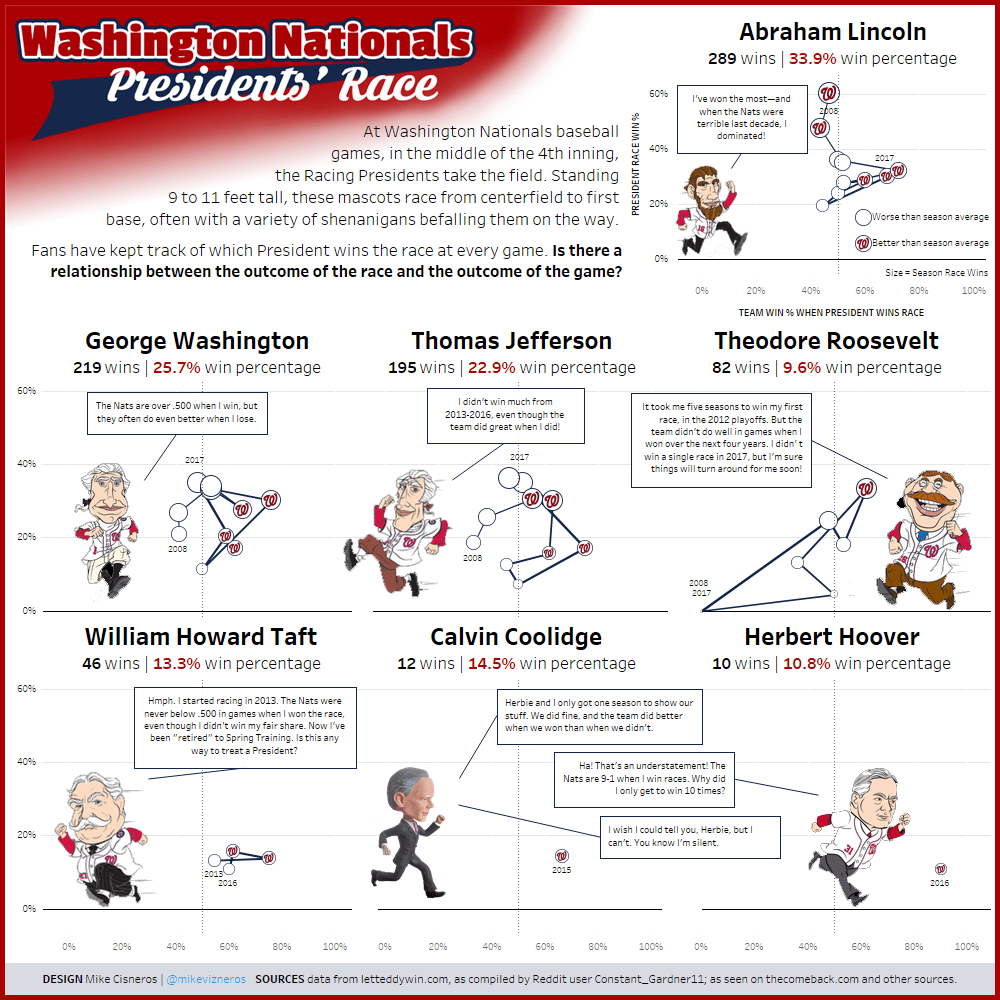
Cisneros is a data visualization guru. He’s head of data visualization at Evince Analytics, and waxes poetic about the art on his personal blog. When Cisneros saw the conclusions drawn by Reddit user Constant Gardner11 yesterday, utilizing ten years of data compiled here at the Let Teddy Win blog, he decided a visualization was in order.
And while it’s a beautiful thing, a few mistakes were made. Roosevelt’s epic losing streak lasted seven seasons — not five (we did not publish race-by-race results for 2016-2017, but the standings are here). And Teddy’s historic first win was not in the playoffs, but on the final day of the 2012 regular season.
And so, feeling both inspired by the beautiful and creative use of our data, and also weirdly compelled to continue to set the record straight, I’ll see you on opening day.